| Total Rows | Total Number of Stroke Cases | Total Stroke Percent | Stroke Cases for 65 and Over | Stroke Percent for Patients 65 and Over | Stroke Cases Under 65 | Stroke Percent Under 65 | Stroke Percent After Removal of 65+ Patient Rows | Number of Patients 65 and Above | Percent of Population 65 and Above | ||||||
| 5110 | 249 | 4.87% | 159 | 3.11% | 90 | 1.76% | 2.20% | 1027 | 20.10% | ||||||
| Context: 1. Stroke cases make up 4.87% of the original dataset. 
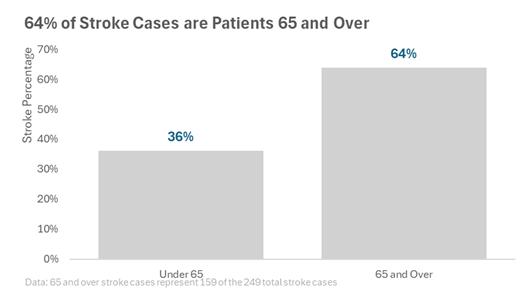
2. Patients that are 65 and over represent 159 of the 249 stroke cases in the dataset, which is 3.11% of the 4.87% overall. 3. After the removal of the rows repesenting patients that are 65 and over, the number of stroke cases is 2.20% of the remaining data. |
|||||||||||||||
|
|||||||||||||||
| Category | Stroke Cases | Percentage | |||||||||||||
| Under 65 | 90 | 36% | |||||||||||||
| 65 and Over | 159 | 64% | |||||||||||||
| 249 | |||||||||||||||
|
|||||||||||||||
| Age Group | Count | Average Risk Factor Count | |||||||||||||
| Under 65 | 4082 | 0.74 | |||||||||||||
| 65 and Above | 1027 | 1.27 | |||||||||||||