|
|
|
|
|
|
|
|
|
|
|
|
|
|
|
|
|
|
|
|
|
|
|
|
|
BMI |
|
|
bmi_category |
Count |
Population % |
In Group Stroke % |
Stroke Count |
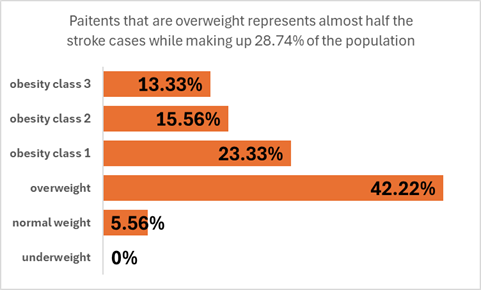
% of Stroke |
|
|
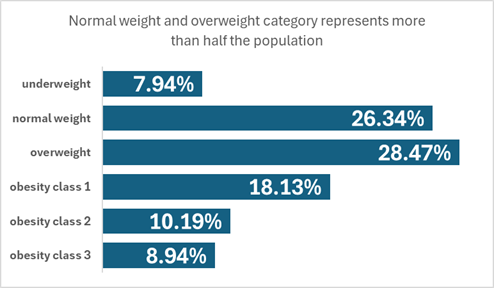
underweight |
324 |
7.94% |
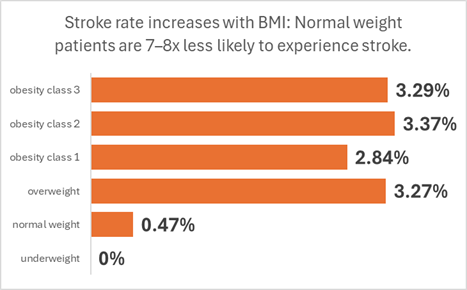
0% |
0 |
0% |
|
|
normal weight |
1075 |
26.34% |
0.47% |
5 |
5.56% |
|
|
overweight |
1162 |
28.47% |
3.27% |
38 |
42.22% |
|
|
obesity class 1 |
740 |
18.13% |
2.84% |
21 |
23.33% |
|
|
obesity class 2 |
416 |
10.19% |
3.37% |
14 |
15.56% |
|
|
obesity class 3 |
365 |
8.94% |
3.29% |
12 |
13.33% |
|
|
|
|
|
|
|
|
|
|
|
|
|
|
|
|
|
|
|
|
|
|
|
|
|
|
|
|
|
|
|
|
|
|
|
|
|
|
Average Glucose Level |
|
Glucose Status |
In Group Stroke % |
Count |
Stroke Count |
|
glucose_category |
Count |
Population % |
In Group Stroke % |
Stroke Count |
% of Stroke |
|
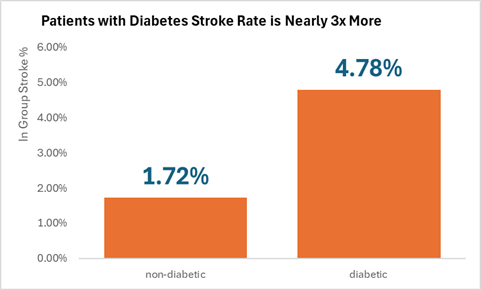
non-diabetic |
1.72% |
3434 |
59 |
|
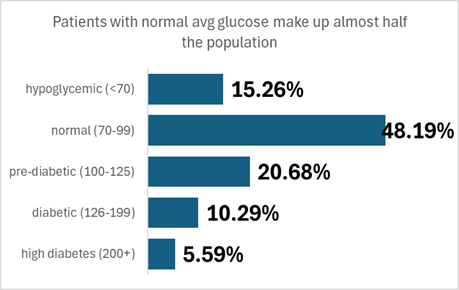
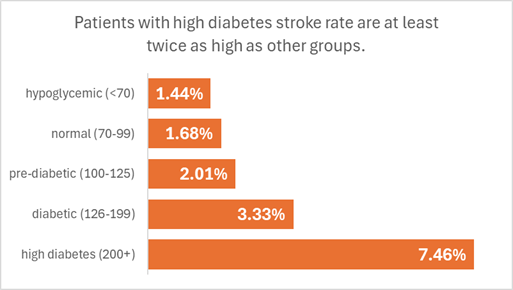
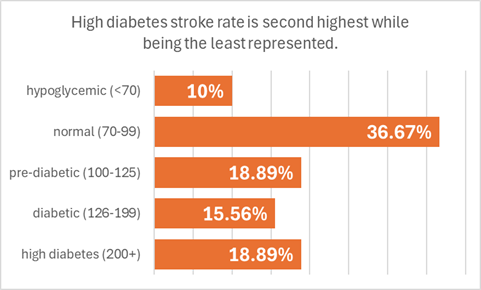
hypoglycemic (<70) |
623 |
15.26% |
1.44% |
9 |
10% |
|
diabetic |
4.78% |
648 |
31 |
|
normal (70-99) |
1967 |
48.19% |
1.68% |
33 |
36.67% |
|
|
pre-diabetic (100-125) |
844 |
20.68% |
2.01% |
17 |
18.89% |
|
|
|
2.78 |
|
|
diabetic (126-199) |
420 |
10.29% |
3.33% |
14 |
15.56% |
|
|
|
|
high diabetes (200+) |
228 |
5.59% |
7.46% |
17 |
18.89% |
|
|
|
|
|
|
|
|
|
|
|
|
|
|
|
|
|
|
|
|
|
|
|
|
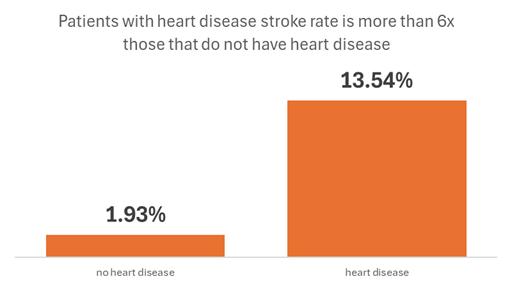
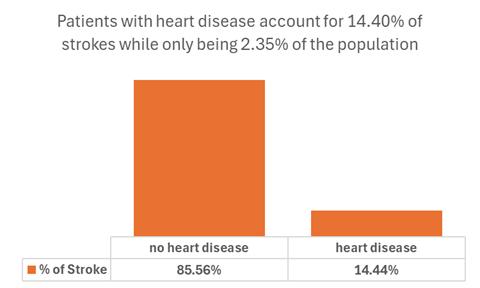
Heart Disease |
|
|
heart_disease_status |
Count |
Population % |
In Group Stroke % |
Stroke Count |
% of Stroke |
|
|
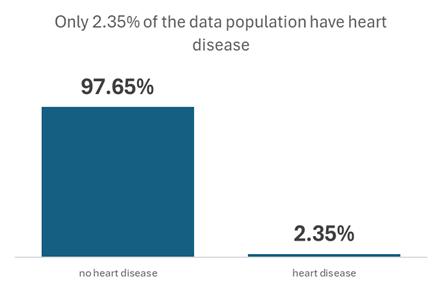
no heart disease |
3986 |
97.65% |
1.93% |
77 |
85.56% |
|
|
heart disease |
96 |
2.35% |
13.54% |
13 |
14.44% |
|
|
|
|
|
|
|
|
|
|
|
|
|
|
|
|
|
|
|
|
|
|
|
|
|
|
|
|
|
|
|
|
|
|
|
|
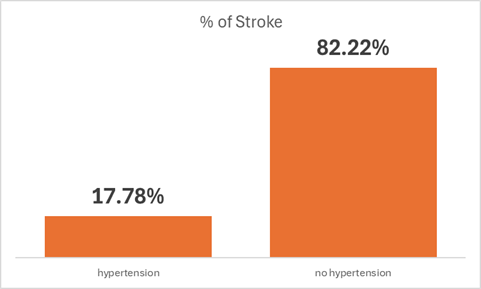
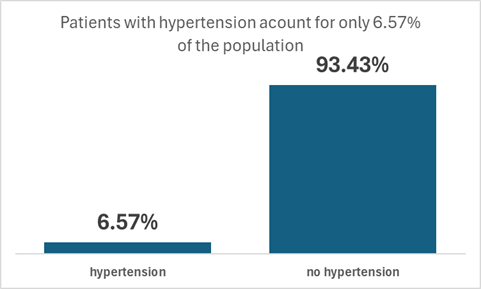
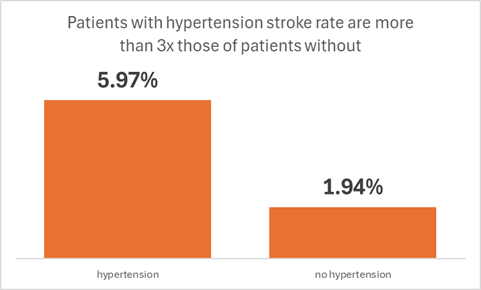
Hypertension |
|
|
hypertension_status |
Count |
Population % |
Stroke Count |
In Group Stroke % |
% of Stroke |
|
|
hypertension |
268 |
6.57% |
16 |
5.97% |
17.78% |
|
|
no hypertension |
3814 |
93.43% |
74 |
1.94% |
82.22% |
|
|
|
|
|
|
|
|
|
|
|
|
|
|
|
|
|
|
|
|
|
|
|
|
|
|
|
|
|
|
|
|
|
|
|
|
|
|
|
|
|
|
|
|
|
|
|
|
|
|
|
|
|
|
|
|
|
|
|
|
|