|
|
|
|
|
|
|
|
|
|
|
|
|
|
|
|
|
|
|
|
|
|
|
|
Feature |
Category |
Population % |
% of Stroke |
In Group Stroke % |
|
|
|
|
|
|
|
|
|
heart_disease |
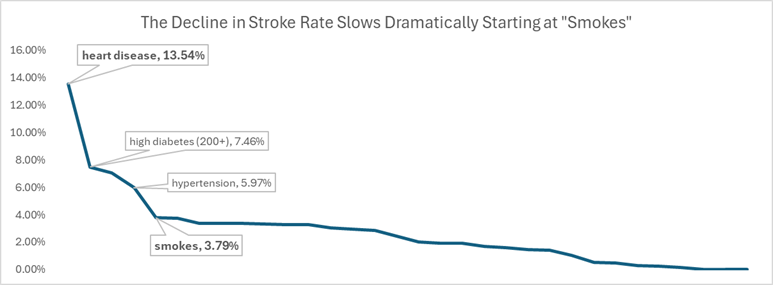
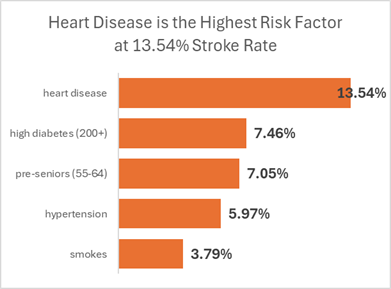
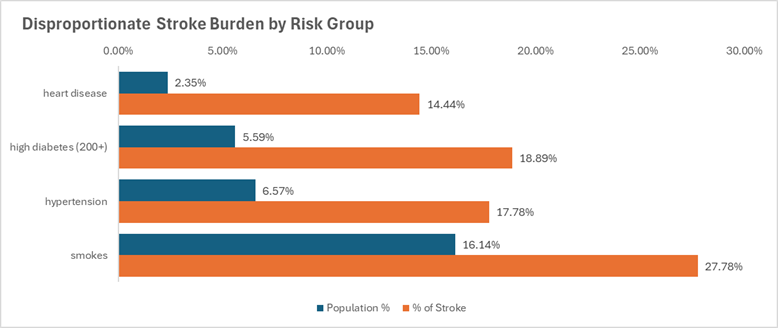
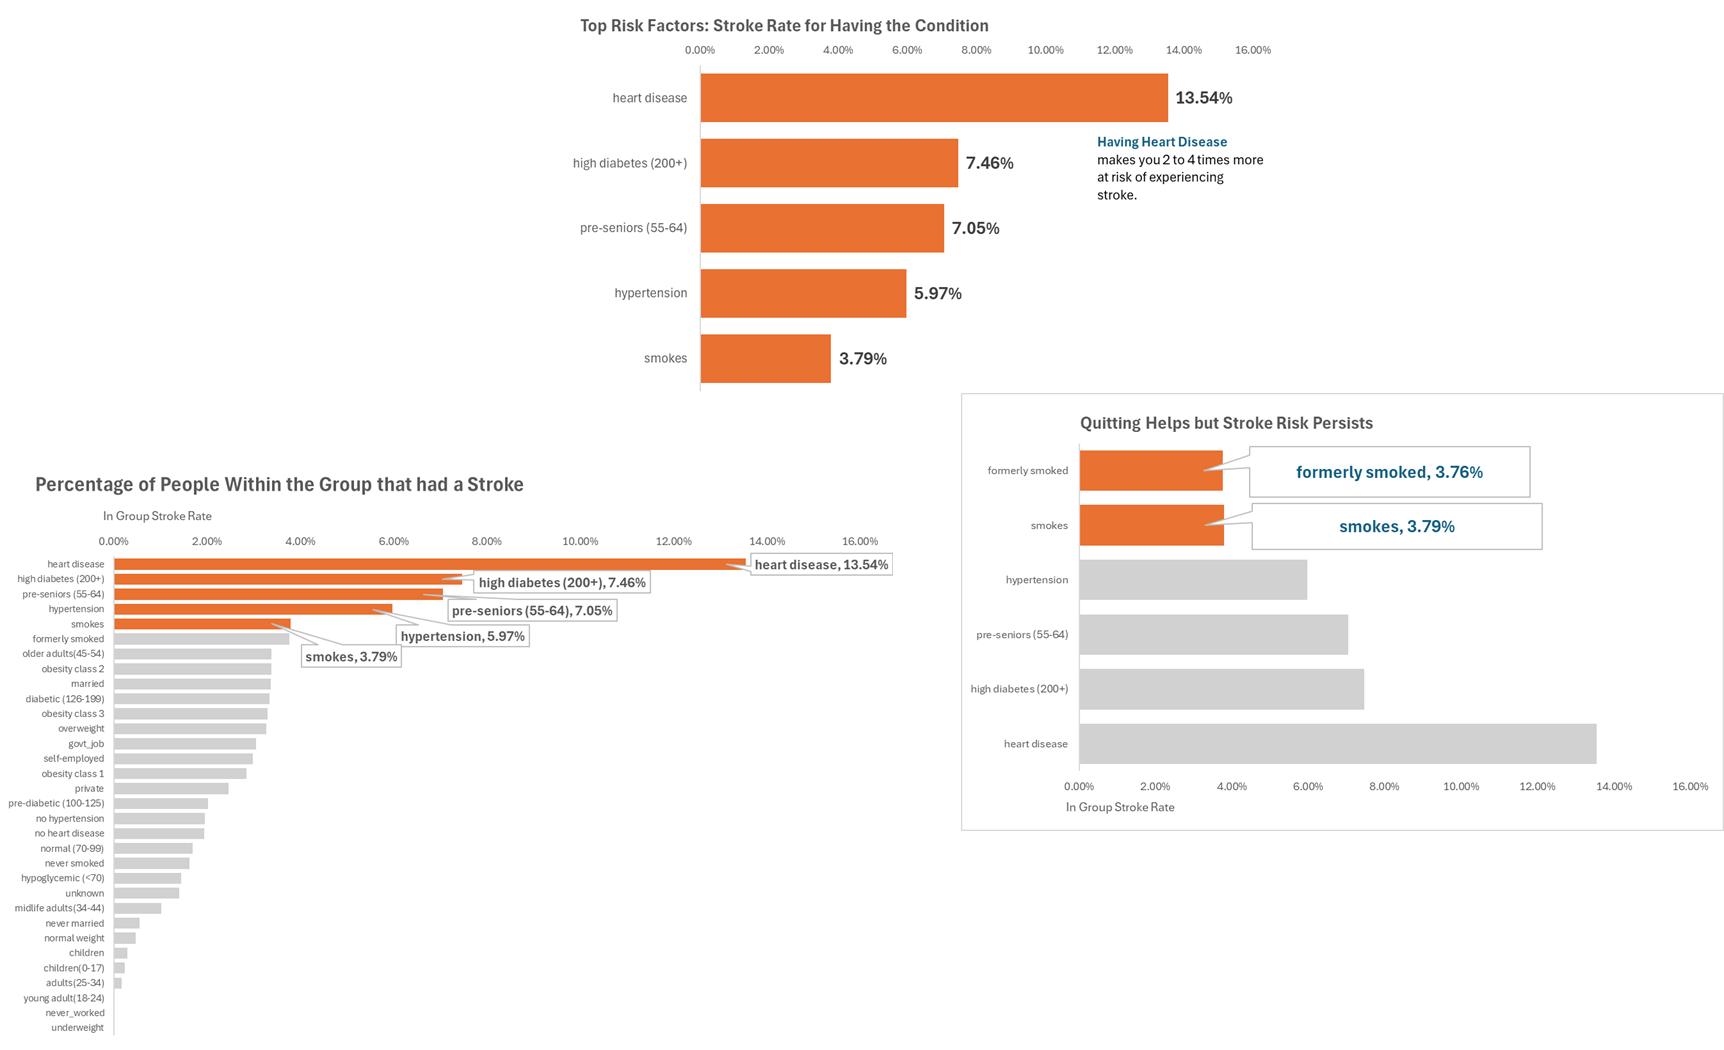
heart disease |
2.35% |
14.44% |
13.54% |
|
|
|
|
|
|
|
|
|
avg_glucose_level |
high diabetes (200+) |
5.59% |
18.89% |
7.46% |
|
|
age |
pre-seniors
(55-64) |
18.42% |
58.89% |
7.05% |
|
|
hypertension |
hypertension |
6.57% |
17.78% |
5.97% |
|
|
smoking_status |
smokes |
16.14% |
27.78% |
3.79% |
|
|
smoking_status |
formerly smoked |
14.33% |
24.44% |
3.76% |
|
|
age |
older
adults(45-54) |
19.55% |
30.00% |
3.38% |
|
|
bmi |
obesity class 2 |
10.19% |
15.56% |
3.37% |
|
|
ever_married |
married |
59.14% |
90.00% |
3.36% |
|
|
avg_glucose_level |
diabetic (126-199) |
10.29% |
15.56% |
3.33% |
|
|
bmi |
obesity class 3 |
8.94% |
13.33% |
3.29% |
|
|
bmi |
overweight |
28.47% |
42.22% |
3.27% |
|
|
work type |
govt_job |
12.89% |
17.78% |
3.04% |
|
|
work type |
self-employed |
10.71% |
14.44% |
2.97% |
|
|
bmi |
obesity class 1 |
18.13% |
23.33% |
2.84% |
|
|
work type |
private |
59.04% |
65.56% |
2.45% |
|
|
avg_glucose_level |
pre-diabetic
(100-125) |
20.68% |
18.89% |
2.01% |
|
|
|
hypertension |
no hypertension |
93.43% |
82.22% |
1.94% |
|
|
heart_disease |
no heart disease |
97.65% |
85.56% |
1.93% |
|
|
avg_glucose_level |
normal (70-99) |
48.19% |
36.67% |
1.68% |
|
|
smoking_status |
never smoked |
36.38% |
26.67% |
1.62% |
|
|
avg_glucose_level |
hypoglycemic (<70) |
15.26% |
10.00% |
1.44% |
|
|
smoking_status |
unknown |
33.15% |
21.11% |
1.40% |
|
|
age |
midlife
adults(34-44) |
16.85% |
7.78% |
1.02% |
|
|
ever_married |
never married |
40.86% |
10.00% |
0.54% |
|
|
bmi |
normal weight |
26.34% |
5.56% |
0.47% |
|
|
work type |
children |
16.83% |
2.22% |
0.29% |
|
|
age |
children(0-17) |
20.97% |
2.22% |
0.23% |
|
|
age |
adults(25-34) |
14.89% |
1.11% |
0.16% |
|
|
age |
young
adult(18-24) |
9.31% |
0.00% |
0.00% |
|
|
work type |
never_worked |
0.54% |
0.00% |
0.00% |
|
|
bmi |
underweight |
7.94% |
0.00% |
0.00% |
|
|
|
|
|
|
|
|
In Group Stroke % |
Population % |
|
|
heart disease |
13.54% |
2.35% |
|
|
high diabetes (200+) |
7.46% |
5.59% |
|
|
pre-seniors
(55-64) |
7.05% |
18.42% |
|
|
hypertension |
5.97% |
6.57% |
|
|
smokes |
3.79% |
16.14% |
|
|
formerly smoked |
3.76% |
14.33% |
|
|
older
adults(45-54) |
3.38% |
19.55% |
|
|
obesity class 2 |
3.37% |
10.19% |
|
|
married |
3.36% |
59.14% |
|
|
diabetic (126-199) |
3.33% |
10.29% |
|
|
obesity class 3 |
3.29% |
8.94% |
|
|
overweight |
3.27% |
28.47% |
|
|
govt_job |
3.04% |
12.89% |
|
|
self-employed |
2.97% |
10.71% |
|
|
obesity class 1 |
2.84% |
18.13% |
|
|
private |
2.45% |
59.04% |
|
|
pre-diabetic (100-125) |
2.01% |
20.68% |
|
|
normal (70-99) |
1.68% |
48.19% |
|
|
hypoglycemic (<70) |
1.44% |
15.26% |
|
|
midlife
adults(34-44) |
1.02% |
16.85% |
|
|
|
|
|
|
|
|
|
|
|
|
|
|
|
|
|
|
|
|
|
|
Top Risk Factors Summary |
|
|
Category |
Population % |
% of Stroke |
In Group Stroke % |
|
|
heart disease |
2.35% |
14.44% |
13.54% |
|
|
high diabetes (200+) |
5.59% |
18.89% |
7.46% |
|
|
pre-seniors (55-64) |
18.42% |
58.89% |
7.05% |
|
|
|
|
|
|
hypertension |
6.57% |
17.78% |
5.97% |
|
|
|
|
|
|
diabetic |
15.87% |
34.44% |
4.78% |
|
|
smokes |
16.14% |
27.78% |
3.79% |
|
|
History of Smoking |
30.48% |
52.22% |
3.78% |
|
|
|
|
|
|
|
|
|
|
|
|
|
|
|
|
|
|
|
|
|
|
|
|
|
|
|
|
|
|
|
Category |
Population % |
% of Stroke |
In Group Stroke % |
|
|
heart disease |
2.35% |
14.44% |
13.54% |
|
|
high diabetes (200+) |
5.59% |
18.89% |
7.46% |
|
|
pre-seniors (55-64) |
18.42% |
58.89% |
7.05% |
|
|
hypertension |
6.57% |
17.78% |
5.97% |
|
|
smokes |
16.14% |
27.78% |
3.79% |
|
|
formerly smoked |
14.33% |
24.44% |
3.76% |
|
|
older adults(45-54) |
19.55% |
30.00% |
3.38% |
|
|
obesity class 2 |
10.19% |
15.56% |
3.37% |
|
|
married |
59.14% |
90.00% |
3.36% |
|
|
diabetic (126-199) |
10.29% |
15.56% |
3.33% |
|
|
obesity class 3 |
8.94% |
13.33% |
3.29% |
|
|
overweight |
28.47% |
42.22% |
3.27% |
|
|
govt_job |
12.89% |
17.78% |
3.04% |
|
|
self-employed |
10.71% |
14.44% |
2.97% |
|
|
obesity class 1 |
18.13% |
23.33% |
2.84% |
|
|
private |
59.04% |
65.56% |
2.45% |
|
|
pre-diabetic (100-125) |
20.68% |
18.89% |
2.01% |
|
|
no hypertension |
93.43% |
82.22% |
1.94% |
|
|
no heart disease |
97.65% |
85.56% |
1.93% |
|
|
normal (70-99) |
48.19% |
36.67% |
1.68% |
|
|
never smoked |
36.38% |
26.67% |
1.62% |
|
|
hypoglycemic (<70) |
15.26% |
10.00% |
1.44% |
|
|
unknown |
33.15% |
21.11% |
1.40% |
|
|
midlife adults(34-44) |
16.85% |
7.78% |
1.02% |
|
|
never married |
40.86% |
10.00% |
0.54% |
|
|
normal weight |
26.34% |
5.56% |
0.47% |
|
|
children |
16.83% |
2.22% |
0.29% |
|
|
children(0-17) |
20.97% |
2.22% |
0.23% |
|
|
adults(25-34) |
14.89% |
1.11% |
0.16% |
|
|
young adult(18-24) |
9.31% |
0.00% |
0.00% |
|
|
never_worked |
0.54% |
0.00% |
0.00% |
|
|
underweight |
7.94% |
0.00% |
0.00% |
|
|
|
|
|
|
|
|
|
|
|
|
|
|
|
|
|
|
|
|
|
|
|
|